
The remote sensing industry is growing exponentially with the proliferation of satellites, drones, big data analytics, and AR/VR as key drivers. Increasingly GIS experts and data analysts are expected to have relevant knowledge and skills in image processing and analysis.
Brief History
Satellite imagery has been used since the 1990s as a data source for digital mapping, and in studies related to land use / land cover changes. In those early days, remote sensing software was a tool for experts and scientists.
Image processing capabilities are now embedded in popular GIS software packages like ArcGIS and QGIS. Since the 20th century data providers have focused on increasing the spatial, spectral, and temporal resolution of their offerings. Now they are beginning to offer end-to-end solutions for actionable intelligence and informed decision-making in a variety of applications.
ArcGIS Lesson Gallery
The ArcGIS Lesson Gallery has an ever-growing collection of focused lessons that teach valuable GIS skills within the context of real-world applications. My earlier article Get Started with the ArcGIS Lesson Gallery discussed the gallery and highlighted the lessons that focused on cartography.
In this article, I will focus on the ArcGIS Pro lessons that are related to satellite imagery and remote sensing. You’ll find other lessons on the gallery when you filter for Imagery & Remote Sensing, but ArcGIS Pro has some unique image processing capabilities that you won’t find in ArcGIS Online. To better understand these capabilities, we’ll look at the following ArcGIS Pro lessons:
- Download Imagery from an Online Database – Search Landsat databases for multispectral imagery of Singapore.
- Access Burn Scars with Satellite Imagery – Calculate a burn index using imagery bands to measure fires in Montana.
- Classify Land Cover to Measure Shrinking Lakes – Compare imagery to calculate area change in Lake Poyang, China.
- Extract Roof Forms for Municipal Development – Create realistic 3D roof forms from Lidar data.
- Calculate Impervious Surfaces from Spectral Imagery – Classify land use types in an image to find impervious surfaces.
Download Imagery from an Online Database
In this lesson, you will find and download Landsat image that covers an area of interest. Since the Landsat will be used for urban planning it must be recent and have less than 10% cloud cover. After downloading the image, you will add it and visualize it in ArcGIS Pro.
Finding and Downloading Landsat data
The Landsat satellite program has collected imagery of our planet since 1972. The entire archive was made free to the public in 2008 and millions of scenes have since been downloaded. ArcGIS users can add the entire Landsat to their maps as an online image service, but you can also download a specific Landsat scene to your computer.
USGS has several tools to download Landsat imagery like the Global Visualization Viewer and Earth Explorer. Instead, you will create or sign into your USGS EROS account, open the LandsatLook Viewer and locate your area of interest. Specify your search parameters in the Load Images window and hit the Show Images button.

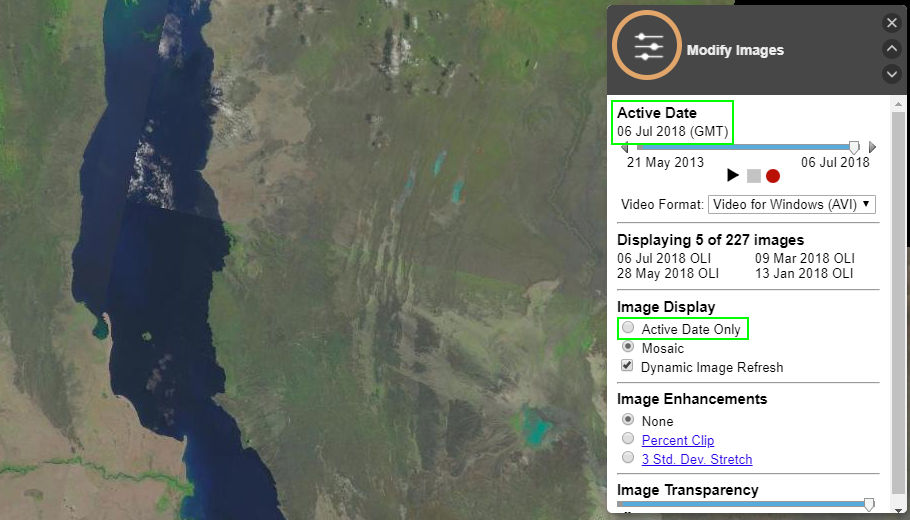
The Modify Images window now opens. It indicates how many images were returned and which ones are currently displayed. Use the time slider to browse through the images by date and select Active Data Only for Image Display if you want to see imagery for a specific date.
When you have identified an image for download click Show Metadata at the bottom of the map display, tick the checkbox next to the image and hit the button under the Standard Product column to download the scene as a Level 1 GEOTIFF Data Product. With a few additional steps you will have downloaded the image(s) of choice to your computer.

Display a Landsat scene in ArcGIS Pro
You’ll first unzip the downloaded Landsat scene to a folder on your computer. The unzipped Landsat consists of 12 individual bands and an MTL.txt raster product When MTL.txt is added to a map in ArcGIS Pro, the Landsat scene is added as a natural color multispectral image. The rendering of the image can now be changed with the Band Combination tool or in the Symbology pane.

Assess Burn Scars with Satellite Imagery
In this lesson Landsat 8 imagery is used to measure the burn scars in an area that has been affected by wildfire. You will calculate a Normalized Burn Index from Landsat 8 imagery before and after the fire. You will first visually explore the imagery with different band combinations, before calculating the Normalized Burn Index and digitizing the burnt areas.
Display Satellite Imagery
At times satellite imagery displays dull and dark, but it can be enhanced by changing the Brightness, Contrast and Gamma parameters in the Enhancement group on the Appearance ribbon of the Raster Layer.
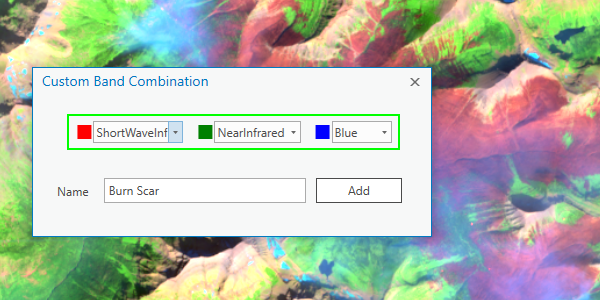
A natural color image doesn’t necessarily distinguish the features of interest, but one can change the Band Combination to Color Infrared or Vegetation Analysis. Burnt areas however are best detected by a Custom Band Combination of ShortWaveInfrared_2, NearInfrared and Blue.
Calculate Normalized Burn Ratio
For an objective assessment of the burnt areas we calculate the Normalized Burn Ratio (NBR) for imagery that was collected before and after the fire. NBR is a band ratio, like the better known NDVI (Normalized Difference Vegetation Index), but it uses different bands and is calculated with the following formula:

The Raster Calculator geoprocessing tool calculates the NBR for the Landsat images before and after the fire, and subsequently calculates the difference between the two with map algebra expressions. The burn scars can then be visualized and digitized to determine their acreage.

Classify Land Cover to Measure Shrinking Lakes
Lake Poyang, China’s largest lake, has been shrinking and water levels are dropping at an alarming rate. In this lesson, you calculate how much the lake has shrunk between 1984 and 2014. To do this you will carry out unsupervised land cover classification on Landsat imagery.
Classify Land Cover
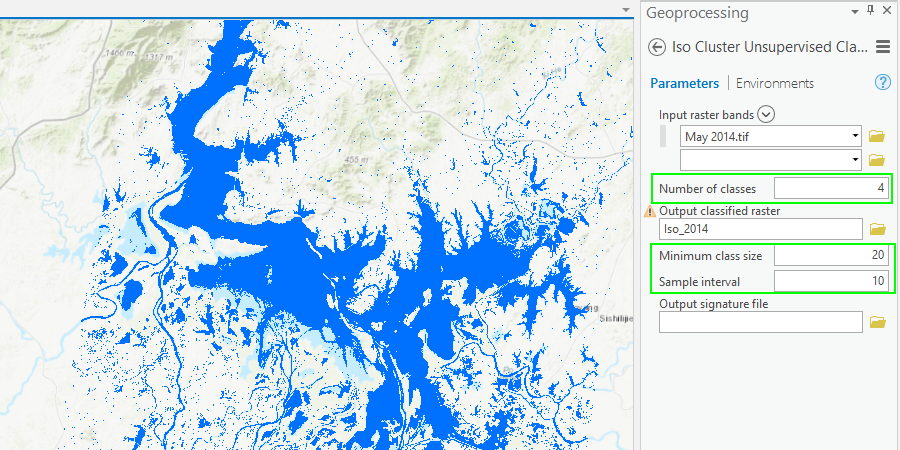
The project has Landsat imagery for June 1984, June 2001, and May 2014. On each of the datasets, you will run the ISO Cluster Unsupervised Classification geoprocessing tool. The tool uses a Maximum Likelihood algorithm to group the pixels into a specified number of classes. You will only specify 4 classes since you are primarily interested in detecting Lake Poyang and use the defaults for Minimum Class Size and Sample Interval.
Generalize Land Cover Classification
Many pixels outside Lake Poyang have been classified as Water and you want to eliminate the smaller areas to get a better estimate of the size of Lake Poyang. The Generalization toolset in the Spatial Analyst Tools toolbox has a variety of tools that can be used to get a cleaner image, and the lesson uses two of them:
- Majority Filter – Reclassifies pixel values if the values of the neighboring cells are different and constitute a majority. The tool can use a neighborhood of 4 or 8 cells and the replacement threshold is set to Majority or Half.
- Boundary Clean – Smooths the boundaries between classes (zones) with an iteration of expansion and shrinking. The tool can be configured to give preference to smaller or larger zones and the iteration can be repeated for a smoother outcome.
The results of the classification before and after the generalization are shown below.

Extracting Roof Forms for Municipal Development
In a 3D scene building footprints can be extruded to create Level of Detail (LOD) 1 buildings, but in this lesson you create LOD 2 buildings by extracting building heights and roof forms from Lidar data. The entire workflow is completed as an ArcGIS Pro task, which runs a chain of step-by-step commands in a guided manner that makes it accessible to novice users.
Create Elevation Layers
ArcGIS Pro works with individual LAS files, but the Create LAS Dataset geoprocessing command references multiple LAS files in a single LAS dataset. This makes working on a project of multiple LAS files much easier since steps don’t need to be repeated. The LAS dataset now becomes the source for the following elevation models:
- Digital Terrain Model (DTM) – shows elevation of the ground without buildings or other features. It is extracted by running the LAS Dataset to Raster geoprocessing command on the LAS dataset after applying a LAS filter that selects the points classified as 2 (Ground).
- Digital Surface Model (DSM) – shows elevation of the ground and other features like buildings. This dataset is extracted with the same command, but here the LAS filter selects all classified Last points from the point cloud to filter out the height of vegetation.
- Normalized Digital Surface Model (nDSM) – shows the difference between the DSM and DTM and is calculated by subtracting the DTM from the DSM with the Minus geoprocessing command.

Extract Building Roof Forms
The three elevation layers (DTM, DSM, nDSM) extracted from the LAS dataset can now be used as input to the Extract Roof Forms geoprocessing command to create a polygon feature class with the LOD 2 buildings. The tool requires the footprints of the 2D buildings as input and has parameters to set the minimum value for roof area, roof facet, and roof height. When Simplify Buildings is checked the Simplify Tolerance value will be used to straighten the building angles.

Calculate Impervious Surfaces from Spectral Imagery
Unsupervised image classification was used to measure the shrinking size of Lake Poyang in China, but this lesson uses supervised image classification to distinguish 7 categories of land use that will be grouped into pervious and impervious surfaces.
Classifying an Image
To classify an image in ArcGIS Pro, select it in the Contents pane and use the Classification Wizard or the Classification Tools to open the individual tools available in the wizard. The wizard is often the best choice since it offers a complete workflow from start to finish. The content of the Classification Tools dropdown is dependent on the active layer and this enables you to repeat and improve key parts of the classification workflow.

The Classification Wizard workflow in the lesson walks you through the following consecutive steps
- In the Configure page you select the Classification Method (Supervised, Unsupervised), the Classification Type (Pixel Base, Object Based) and the Classification Schema. In the lesson you will perform a supervised, object-based classification with a default schema which is based on USGS land cover types.
- The Segment page will open since you selected an Object-Based classification, which groups adjacent pixels into segments based on their spectral similarity and spatial proximity. On the page, you assign importance to Spectral detail and Spatial detail and set the value for Minimum segment size in pixels as input parameters for the segmentation.
- Since you selected a supervised classification the Training Samples Manager page will open. In this page you manage the classification schema by adding, removing, and editing your classes. On the page, you’ll find the tools to draw training samples that are representative of the classes in the schema.
- The next page of the wizard is the Train page where you confirm Support Vector Machine as the Classifier and change Maximum Number of Samples per Class to 0 to ensure that all your training samples are used in training the classifier.
- The next page is the Classify page where you run the actual classification and save the results to your database.
- Next is the Merge Classes page where you merge the Gray Roof, Roads and Driveways classes to Impervious and the Bare Earth, Grass, Water and Shadows classes to Pervious.
- The final page of the wizard is the Reclassify page where you correct any obvious classification errors.
Wrapping Up
The Lesson Gallery has many important lessons about image processing in ArcGIS Pro. In a short time it taught us how to work with Landsat and other multispectral data, perform unsupervised and supervised image classification and extract data layers and features from LiDAR data.
Image processing tasks tend to be computing-intensive, but ArcGIS Pro performed without a hitch. ArcGIS Pro tasks and tools like the Classification Wizard guide the user through complicated workflows and are extremely useful in acquiring new competencies.
Advanced remote sensing applications typically require specialized remote sensing software, custom code, and multiple datasets over an extended time-period. I nevertheless hope that this article equips you to use imagery and remote sensing in your work and motivates you to dig deeper.